Negative Binomial Hurdle Models

Modelling
Hurdle Models
Alcohol Use
Psychological Distress
Modelling psychological distress, alcohol and other drug use, and occupational functioning in Australian Public Safety Personnel
Published

March 31, 2026

Introduction

In this analysis, I model alcohol and other drug use, psychological distress, and occupational functioning in Australian public safety personnel (PSP). The aims of the analysis are to:

  1. Describe the rates and severity of alcohol and other drug (AOD) use in a sample of Australian public safety personnel (PSP)
  2. Examine associations between AOD use, psychological distress, and occupational functioning (absenteeism and presenteeism)
  3. Test whether AOD use and psychological distress, independently and together, predict occupational impairment

Set-Up

Show/hide the code
# load packages 

pacman::p_load(here, tidyverse, dplyr, scales, rstatix, forecast, gtsummary, flextable, officer, ggplot2, ggpubr, dunn.test, rcompanion, MASS, pscl, AER, car, marginaleffects )
# set wd 
here::i_am("projects/hurdles/index.qmd")
# load data 
df <- readRDS(here::here("R/clean_self_assessment.RData"))
# filter to time 1 
df <- df |> filter(assessment_time == "Time 1")
# source custom flextable function 
source(here("R/customflextable.R"))

# set chunk options
knitr::opts_chunk$set(message = FALSE, warning = FALSE)

Key variables

Role Variable(s)
Psychological distress k10_total, k10_total_interpretation
Alcohol use alcohol_use_scores, alcohol_use_interpretation
Other drug use max_other_drug_score, max_drug_use_interpretation
Occupational functioning k10_11_absenteeism, k10_12_presenteeism
Potential covariates gender, age, agency_years

Screening

Show/hide the code
# Shapiro-Wilk for all relevant vars
options(scipen = 999)
tbl_shapiro <- df |>
  # select vars 
 dplyr::select(age, agency_years, alcohol_use_scores, max_other_drug_score, k10_total, k10_11_absenteeism, k10_12_presenteeism) |> 
  # pivot longer so variable name is one col and shapiro stat is the other 
  pivot_longer(everything(), names_to = "var", values_to = "value") |>
  group_by(var) |>
  shapiro_test(value) |>
  # rename each var for the table 
  mutate(
    var = c(
      "Age",
      "Agency Years",
      "Alcohol Use Risk",
      "Other Drug Use Risk",
      "Psychological Distress",
      "Absenteeism",
      "Presenteeism"
    ),
    variable = NULL,
    # round numbers 
    statistic = number(statistic, accuracy = .001),
    p = number(p, accuracy = .001)
  ) |>
  rename(Variable = var, Statistic = statistic) |>
  # convert to flextable 
  flextable() |> 
  # apply my flextable formatting from `my_flextable(font_size = 10)
  my_flextable(font_size = 10)

tbl_shapiro
Table 1: Shapiro tests of numeric variables

Variable

Statistic

p

Age

0.946

0.000

Agency Years

0.883

0.000

Alcohol Use Risk

0.933

0.000

Other Drug Use Risk

0.452

0.000

Psychological Distress

0.649

0.000

Absenteeism

0.949

0.000

Presenteeism

0.840

0.000

Shapiro-wilk tests confirm violations of normality. Non-parametric tests should be used for group comparisons (Kruskal-Wallis) that use risk categories as grouping variable

Show/hide the code
# visualise absenteeism and presenteeism 
fig_histograms <- df |>
  dplyr::select(Absenteeism = k10_11_absenteeism, Presenteeism = k10_12_presenteeism) |> 
  # pivot longer
  pivot_longer(
    cols = c(Absenteeism, Presenteeism),
    names_to = "Variable",
    values_to = "Days") |> 
  # filter NA answers 
  filter(!is.na(Days)) |>
  # create histograms
  gghistogram(
    x = "Days",
    y = "count",
    xlab = "Days",
    ylab = FALSE,
    add = "median",
    facet.by = "Variable",
    binwidth = 1
  ) +
  scale_x_continuous(breaks = seq(0, 30, by = 5))
fig_histograms
Figure 1: Histograms of absenteeism and presenteeism

Seems to be a strong right skew and large proportion of zeros. This suggests standard linear models would be inappropriate. might be better to work with count based models.

Prevalence and Severity of AOD Use

Show/hide the code
# pivot assist vars to long
# apply risk categories
tbl_rates <- df |>
  dplyr::select(starts_with("assist_total_"), -assist_total_scores_count) |>
  pivot_longer(
    cols = starts_with("assist_total_"),
    names_to = "substance",
    values_to = "score"
  ) |>
  mutate(score = case_when(score < 1 ~ NA, TRUE ~ score)) |>
  filter(!is.na(score)) |>
  mutate(
    substance = str_remove(substance, "assist_total_") |> str_to_title()
  ) |>
  mutate(
    `Risk` = case_when(
      substance == "Alcohol" & score < 10 ~ "Low risk",
      substance == "Alcohol" &
        score >= 10 &
        substance == "Alcohol" &
        score <= 26 ~ "Moderate risk",
      substance == "Alcohol" & score > 26 ~ "High risk",
      substance != "Alcohol" & score < 4 ~ "Low risk",
      substance != "Alcohol" &
        score >= 4 &
        substance != "Alcohol" &
        score <= 26 ~ "Moderate risk",
      substance != "Alcohol" & score > 26 ~ "High risk",
      TRUE ~ "fix"
    )
  ) |>
  group_by(substance, Risk) |>
  summarise(
    n = n()
  ) |>
  ungroup() |>
  group_by(substance) |>
  mutate(total = sum(n), percent = round(100 * n / sum(n), 1)) |>
  group_by(substance, Risk) |>
  ungroup() |>
  dplyr::select(substance, total, Risk, n, percent) |>
  pivot_wider(names_from = Risk, values_from = c(n, percent)) |>
  dplyr::select(
    Substance = substance,
    total,
    ends_with("Low risk"),
    ends_with("Moderate risk"),
    ends_with("High risk")
  ) |>
  mutate(
    total = paste0(total, " (", number(total / 220 * 100, accuracy = .1), "%)")
  ) |>
  filter(Substance != 'Other') |>
  filter(Substance != "Smoking") |>
  flextable()

# change spanning headers to group n and % under each risk category
typology <- data.frame(
  col_keys = c(
    "Substance",
    "total",
    "n_Low risk",
    "percent_Low risk",
    "n_Moderate risk",
    "percent_Moderate risk",
    "n_High risk",
    "percent_High risk"
  ),
  head = c("", "", rep("ASSIST scores", 6)),
  risk = c(
    "",
    "",
    rep("Low risk", 2),
    rep("Moderate risk", 2),
    rep("High risk", 2)
  ),
  names = c("Substance", "Total using", rep(c("n", "%"), 3))
)

# print and format rates table
tbl_rates <- tbl_rates |>
  set_header_df(mapping = typology, key = "col_keys") |>
  merge_h(part = "header") |>
  my_flextable(font_size = 10) |>
  hline(
    border = fp_border(color = "black", width = 1),
    i = c(1, 2),
    part = "header"
  ) |>
  hline_top(border = fp_border(color = "black", width = 1), part = "all") |> 
  align(j = c(2:8), align = "center", part = "all")

tbl_rates
Table 2: Rates of substance use in past three months by risk category

ASSIST scores

Low risk

Moderate risk

High risk

Substance

Total using

n

%

n

%

n

%

Alcohol

216 (98.2%)

77

35.6

83

38.4

56

25.9

Amphetamines

23 (10.5%)

5

21.7

16

69.6

2

8.7

Cannabis

28 (12.7%)

6

21.4

20

71.4

2

7.1

Cocaine

27 (12.3%)

12

44.4

13

48.1

2

7.4

Hallucinogens

18 (8.2%)

4

22.2

12

66.7

2

11.1

Inhalants

14 (6.4%)

6

42.9

6

42.9

2

14.3

Opioids

12 (5.5%)

5

41.7

6

50.0

1

8.3

Sedatives

26 (11.8%)

7

26.9

18

69.2

1

3.8

Alcohol use is nearly universal, and meaningfully spread. Other substance use is less prevalent, but does seem to be more moderate risk (although, the low-risk threshold is quite low, so even occasional use is likely to be at least moderate). High risk other drug use is less common, but still evident. Cannabis, amphetamines, and sedatives are more skewed toward moderate risk rather than low risk.

Descriptives Based on Alcohol Risk

Show/hide the code
# turn low cell counts to NA 
df <- df %>% mutate(gender = case_when(gender == "Prefer not to answer" ~ NA,
                                       gender == "Other" ~ NA,
                                       TRUE ~ gender),
                    gender = factor(gender))

tbl_alc <- df |>

# restrict to use in past 3 months 
  filter(recent_alcohol_user == 1) |>
  dplyr::select(
    gender,
    age,
    agency_years,
    alcohol_use_interpretation,
    k10_total,
    absenteeism = k10_11_absenteeism,
    presenteeism = k10_12_presenteeism
  ) |>
  tbl_summary(
    by = alcohol_use_interpretation,
    missing = "no",
    missing_text = "Missing",
    statistic = list(
      all_continuous() ~ c("{mean} ({sd})"),
      all_categorical() ~ "{n} ({p}%)"
    ),
    percent = "row",
    digits = list(all_continuous() ~ c(1, 1), all_categorical() ~ c(0, 1)),
    label = list(
      gender = "Gender",
      age = "Age",
      k10_total = "Psychological distress",
      absenteeism = "Absenteeism",
      presenteeism = "Presenteeism",
      agency_years = "Agency years",
      alcohol_use_interpretation = "Alcohol use risk category"
    )
  ) |>
  add_n(statistic = "{N_nonmiss}", col_label = "n") |>
  modify_header(list(
    label ~ "Characteristic",
    stat_1 ~ "Low Risk\n(n = 77)",
    stat_2 ~ "Moderate Risk\n(n = 83)",
    stat_3 ~ "High Risk\n(n = 56)"
  )) |>
  add_p(
    test = list(all_continuous() ~ "kruskal.test", gender ~ "chisq.test"),
    pvalue_fun = function(x) {
      formatted <- ifelse(x < 0.001, "<.001", sprintf("%.3f", x))
      sub("^0\\.", ".", formatted)
    }
  ) |>
  add_stat_label(
    label = list(all_continuous() ~ "Mean (SD)", all_categorical() ~ "n (%)")
  ) |>
  modify_footnote(everything() ~ NA) |>
  modify_header(p.value ~ "p") |>
  gtsummary::as_flex_table() |> 
  my_flextable(font_size = 10)
tbl_alc 
Table 3: Sample characteristics by alcohol use risk levels

Characteristic

n

Low Risk
(n = 77)

Moderate Risk
(n = 83)

High Risk
(n = 56)

p

Gender, n (%)

189

.011

Man or male

30 (26.8%)

52 (46.4%)

30 (26.8%)

Woman or female

35 (45.5%)

21 (27.3%)

21 (27.3%)

Age, Mean (SD)

187

37.2 (11.2)

42.8 (12.9)

40.6 (9.7)

.024

Agency years, Mean (SD)

196

8.0 (7.9)

12.9 (9.7)

10.8 (9.8)

.006

Psychological distress, Mean (SD)

202

18.9 (7.7)

20.9 (6.8)

25.4 (7.2)

<.001

Absenteeism, Mean (SD)

200

1.3 (4.3)

1.4 (4.1)

3.2 (5.7)

<.001

Presenteeism, Mean (SD)

200

4.4 (8.5)

2.0 (4.3)

7.6 (9.0)

<.001

Higher alcohol risk is associated with greater psychological distress and higher absenteeism and presenteeism. Age and agency years are higher in the moderate/higher risk groups - which might be related to cumulative exposure to traumatic events?

Show/hide the code
# post hoc pairwise comparisons - include for completeness. 
tests <- df |> filter(recent_alcohol_user == 1)

dunn.test(tests$age, tests$alcohol_use_interpretation, kw = TRUE, method = "bonferroni")

dunn.test(tests$agency_years, tests$alcohol_use_interpretation, kw = TRUE, method = "bonferroni")

dunn.test(tests$k10_total, tests$alcohol_use_interpretation, kw = TRUE, method = "bonferroni")

dunn.test(tests$k10_11_absenteeism, tests$alcohol_use_interpretation, kw = TRUE, method = "bonferroni")

dunn.test(tests$k10_12_presenteeism, tests$alcohol_use_interpretation, kw = TRUE, method = "bonferroni")

# gender - chi-squared then pairwise 
report::report(stats::chisq.test(tests$gender, tests$alcohol_use_interpretation)) 

gender_tbl <- table(tests$gender, tests$alcohol_use_interpretation)
pairwiseNominalIndependence(gender_tbl, fisher = FALSE, gtest = FALSE, chisq = TRUE, method = "bonferroni")

prop.table(table(tests$gender, tests$alcohol_use_interpretation), margin = 1)

Post hoc dunn tests with bonferroni correction show most differences are driven by low vs. moderate/high. moderate vs. high risk are pretty similar.

Descriptives Based on Other Drug Risk

Show/hide the code
tbl_drug <- df |>
  filter(recent_drug_user == 1) |>
  dplyr::select(
    gender,
    age,
    agency_years,
    max_drug_use_interpretation,
    k10_total,
    absenteeism = k10_11_absenteeism,
    presenteeism = k10_12_presenteeism
  ) |>
  tbl_summary(
    by = max_drug_use_interpretation,
    missing = "no",
    missing_text = "Missing",
    statistic = list(
      all_continuous() ~ c("{mean} ({sd})"),
      all_categorical() ~ "{n} ({p}%)"
    ),
    percent = "row",
    digits = list(all_continuous() ~ c(1, 1), all_categorical() ~ c(0, 1)),
    type = list(
      recent_drug_count = "continuous",
      #recent_alcohol_user = "categorical",
      recent_drug_user = "categorical",
      poly_drug_user = "categorical"
    ),
    label = list(
      gender = "Gender",
      age = "Age",
      k10_total = "Psychological distress",
      absenteeism = "Absenteeism",
      presenteeism = "Presenteeism",
      agency_years = "Agency years",
      max_drug_use_interpretation = "Maximum other drug use risk category"
    )
  ) |>
  add_n(statistic = "{N_nonmiss}", col_label = "n") |>
  modify_header(list(
    label ~ "Characteristic",
    stat_1 ~ "Low Risk\n(n = 17)",
    stat_2 ~ "Moderate Risk\n(n = 46)",
    stat_3 ~ "High Risk\n(n = 5)"
  )) |>
  add_p(
    test = list(all_continuous() ~ "kruskal.test", gender ~ "fisher.test"),

    #test.args = all_categorical() ~ list(simulate.p.value = TRUE),
    pvalue_fun = function(x) {
      formatted <- ifelse(x < 0.001, "<.001", sprintf("%.3f", x))
      sub("^0\\.", ".", formatted)
    }
  ) |>
  add_stat_label(
    label = list(all_continuous() ~ "Mean (SD)", all_categorical() ~ "n (%)")
  ) |>

  modify_footnote(everything() ~ NA) |>
  modify_header(p.value ~ "p") |>
  gtsummary::as_flex_table() |>
  my_flextable(font_size = 10)
tbl_drug
Table 4: Sample characteristics by other drug use risk levels

Characteristic

n

Low Risk
(n = 17)

Moderate Risk
(n = 46)

High Risk
(n = 5)

p

Gender, n (%)

56

.789

Man or male

8 (22.2%)

26 (72.2%)

2 (5.6%)

Woman or female

6 (30.0%)

13 (65.0%)

1 (5.0%)

Age, Mean (SD)

59

41.2 (12.4)

37.7 (12.1)

32.6 (8.6)

.382

Agency years, Mean (SD)

61

11.2 (11.9)

8.5 (6.6)

5.0 (3.0)

.501

Psychological distress, Mean (SD)

61

19.7 (7.7)

24.6 (8.4)

34.2 (10.6)

.011

Absenteeism, Mean (SD)

61

0.7 (1.4)

2.3 (3.6)

10.2 (11.9)

.037

Presenteeism, Mean (SD)

61

3.6 (5.2)

7.2 (9.0)

8.4 (8.7)

.440

Much smaller n here (especially high risk group, n = 5); interpret w caution. Fisher’s exact test used for gender given small cell sizes.

Psychological distress and absenteeism seem to show a dose-reponse pattern across risk groups. Presenteeism is the same direction, but not significant, possible power issues.

Age and agency years and gender = no differences; contrast with alcohol use results.

Show/hide the code
# post hoc pairwise comparisons - included for completeness. 
tests <- df |> filter(recent_drug_user == 1)
dunn.test(tests$age, tests$max_drug_use_interpretation, kw = TRUE, method = "bonferroni")
dunn.test(tests$agency_years, tests$max_drug_use_interpretation, kw = TRUE, method = "bonferroni")
dunn.test(tests$k10_total, tests$max_drug_use_interpretation, kw = TRUE, method = "bonferroni")
dunn.test(tests$k10_11_absenteeism, tests$max_drug_use_interpretation, kw = TRUE, method = "bonferroni")
dunn.test(tests$k10_12_presenteeism, tests$max_drug_use_interpretation, kw = TRUE, method = "bonferroni")

dunn tests aren’t really reliable here.

Associations between AOD Use, Psychological Distress, and Occupational Functioning

Correlations

Show/hide the code
# select vars 
df_cor_vars <- df |>
  dplyr::select(
    alcohol_use_scores, max_other_drug_score, 
    k10_total, absenteeism = k10_11_absenteeism, presenteeism = k10_12_presenteeism
  ) 

# define variable types 
vars_continuous <- c("k10_total", "alcohol_use_scores", "max_other_drug_score")
vars_count <- c('presenteeism', 'absenteeism', 'recent_drug_count')

# get all correlation pairs 
cor_pairs <- combn(names(df_cor_vars), 2, simplify = FALSE)

# create function to get correct correlation type automatically 
get_cors <- function(x_name, y_name, data) {
  x <- data[[x_name]]
  y <- data[[y_name]]
  
  # define variable types 
  is_x_count <- x_name %in% vars_count
  is_y_count <- y_name %in% vars_count
  is_x_continuous <- x_name %in% vars_continuous
  is_y_continuous <- y_name %in% vars_continuous
  
  # define correlation method 
  cor_method <- case_when(
    is_x_count & is_y_count ~ "spearman", # use spearman
    is_x_count & is_y_continuous ~ "spearman", # use spearman
    is_x_continuous & is_y_count ~ "spearman", # use spearman
    is_x_continuous & is_y_continuous ~ "pearson",  # use pearson 
    TRUE ~ "spearman"  # if else, use spearman 
  )
  
  cor_type <- case_when(
    is_x_continuous & is_y_continuous ~ "pearson",
    TRUE ~ "spearman"
  )
  
  # calculate correlations 
  cor_test <- suppressWarnings(cor.test(x, y, method = cor_method))
  
  # return correlation coefficient, p-value, method used
  list(r = unname(cor_test$estimate), p = cor_test$p.value, method = cor_method, type = cor_type)
}

# compute correlations for all pairs 
results_cor <- purrr::map_dfr(cor_pairs, function(vars) {
  res <- get_cors(vars[1], vars[2], df_cor_vars)
  tibble(
    var1 = vars[1],
    var2 = vars[2],
    cor = res$r,
    p = number(res$p, accuracy = .001),
    method = res$cor_method,
    type = res$cor_type#,
    #p2 = res$p
  )
})

# make symmetric by mirroring rows
df_cor_long <- results_cor |>
  bind_rows(
    results_cor |>
      rename(var1 = var2, var2 = var1)
  ) |>
  mutate(
    cor = round(cor, 2),
    sig = p <= 0.05,
    stars = case_when(
      p < .001 ~ "***",
      p < .01 ~ "**", 
      p < .05 ~ "*",
      TRUE ~ ""),
    cor_ch = paste0(formatC(cor, format = "f", digits = 2), stars))
  
# make wide 
matrix_cor <- df_cor_long |>
  dplyr::select(var1, var2, cor_ch) |>
  pivot_wider(names_from = var2, values_from = cor_ch) |> 
  dplyr::select(var1, alcohol_use_scores, max_other_drug_score, k10_total, absenteeism, presenteeism)

# set cor labels 
labs_cor <- c(
  k10_total = "Psychological Distress",
  presenteeism = "Presenteeism",
  absenteeism = "Absenteeism",
  alcohol_use_scores = "Alcohol Use Score",
  max_other_drug_score = "Max Other Drug Score")

colnames(matrix_cor) <- c(" " = "var1", labs_cor[colnames(matrix_cor)[-1]])
matrix_cor[[1]] <- labs_cor[matrix_cor[[1]]]
matrix_cor[upper.tri(matrix_cor)] <- NA

# create ft 
tbl_cors <- flextable(matrix_cor) |> 
  my_flextable(font_size = 10) |> 
  set_header_labels("var1" = " ")

tbl_cors
Table 5: Correlation matrix of key variables

Alcohol Use Score

Max Other Drug Score

Psychological Distress

Absenteeism

Presenteeism

Alcohol Use Score

Max Other Drug Score

0.18

Psychological Distress

0.39***

0.33**

Absenteeism

0.28***

0.44***

0.52***

Presenteeism

0.24**

0.28*

0.49***

0.51***

Used pearson for continuous-continuous pairs (alcohol score, drug score, k10 score) and Spearman for pairs involving absenteeism/presenteeism - count variables, zero inflated, rank based more appropriate (see Figure 1)

Pretty much everything is highly correlated (ranging from .18 - .52).

Strongest associations are with psychological distress (particularly with absenteeism and presenteeism), but that makes conceptual sense. Might be also that they come from the k10+? Questions specifically asks “due to the symptoms described” (in the k10), so naturally they would be correlatedexcept for alcohol use and other drug use.

Weaker associations between alcohol use and other drug use which is sort of good for modelling - no collinearity

Model selection

Considered several candidate models that fit the data for absenteeism and presenteeism:

  • Poisson regression
  • Negative binomial regression
  • Zero-inflated Poisson (ZIP)
  • Zero-inflated negative binomial models (ZINB)
  • Hurdle negative binomial models
Show/hide the code
# round absenteeism and presenteeism 
df <- df |> mutate(
  k10_11_absenteeism = round(k10_11_absenteeism, 1),
  k10_12_presenteeism = round(k10_12_presenteeism, 1)
) |> rename(absenteeism = k10_11_absenteeism, 
             presenteeism = k10_12_presenteeism)
# select vars 
df_sub <- df |> dplyr::select(age, gender, agency_years, k10_total, rtc_3_readiness, 
                               recent_drug_user, recent_alcohol_user, recent_any_user, poly_drug_user,
                               alcohol_use_scores, max_other_drug_score, absenteeism, presenteeism)

# create function for comparing models 
predictors <- df_sub |> dplyr::select(-absenteeism, -presenteeism) |> names()

# function to run series of univariate models and check dispersion. 
compare_models <- function(var, data) {
  fmla <- as.formula(paste(outcome, "~", var))

  # print results:
  cat("\n============================\n")
  cat("Variable:", var, "\n")
  cat("============================\n\n")
  
  # fit models 
  # poisson
  pois <- glm(fmla, data = data, family = poisson())
  # negative binomial
  nb <- glm.nb(fmla, data = data)
  # zero inflated poisson
  zip <- zeroinfl(fmla, data = data, dist = "poisson")
  # zero inflated negative binomial
  zinb <- zeroinfl(fmla, data = data, dist = "negbin")
  # hurdle negative binomial 
  hurdle_nb <- hurdle(fmla, data = data, dist = "negbin", zero.dist = "binomial")
  
  # dispersion:
  disp_stat <- dispersiontest(pois)$statistic 
  cat('Dispersion (Poisson):', round(disp_stat, 2), '\n')
  
  # compare AIC / BIC
  aic_df <- AIC(pois, nb, zip, zinb, hurdle_nb)
  bic_df <- BIC(pois, nb, zip, zinb, hurdle_nb)
  
  cat("\nAIC Comparison:\n")
  print(aic_df)
  cat("\nBIC Comparison:\n")
  print(bic_df)
  
  # vuong tests
  cat("\nVuong Test: ZIP vs Poisson\n")
  print(vuong(pois, zip))
  
  cat("\nVuong Test: ZINB vs NB\n")
  print(vuong(nb, zinb))
  
  cat("\nVuong Test: Hurdle vs NB\n")
  print(vuong(nb, hurdle_nb))

# get predicted vs observed zeros 
obs_zeros <- sum(data[[outcome]] == 0)
pred_zeros <- list(
  Poisson = sum(predict(pois, type = "response") < 1e-6),
  NB = sum(predict(nb, type = "response") < 1e-6),
  ZIP = sum(predict(zip, type = "response") < 1e-6),
  ZINB = sum(predict(zinb, type = "response") < 1e-6),
  Hurdle = sum(predict(hurdle_nb, type = "response") < 1e-6)
)

cat("\nObserved Zeros:", obs_zeros, "\n")
cat("Predicted Zeros:\n")
print(pred_zeros)
}

# run and save externally 
outcome <- "absenteeism"
predictors <- df_sub |> dplyr::select(-presenteeism, -absenteeism) |> names()

sink(here("R/model_comparisons_absenteeism.txt"))
lapply(predictors, compare_models, data = df_sub |> filter(!is.na(absenteeism)))
sink()

outcome <- "presenteeism"
sink(here("R/model_comparisons_presenteeism.txt"))
lapply(predictors, compare_models, data = df_sub |> filter(!is.na(presenteeism)))
sink()

Overdispersion was confirmed across all predictors. Poisson dispersion consistently >1 (not a good candidate).Zero-inflated and hurdle models outperformed NB on AIC/BIC and predicted zeros better. Vuong tests favoured hurdle and zero-inflated, though difference between ZINB and hurdle NB was small.

Fit statistics between ZINB and hurdle NB were similar enough.

Important!!!

MS and I discussed this, and we think zero-inflation models were too rigid for our outcomes.

zero inflated models assume 2 groups: ppl structurally always zero (i.e., will never ever have any absenteeism/presenteeism) and people who are at risk. Hurdle models seem more appropriate, because they model the likelihood of someone crossing into abscence/not, and then a seperate model to determine how many days are lost if they do…. this fits our research question better…

Notedecision: Hurdle negative binomial models

They account for overdispersion, handle excess zeros in two stages, and align with our aims

Modelling Absenteeism

Each predictor was examined as univariate effect before building multivariable model to see variable-specific effects and check that the hurdle structure was good.

Show/hide the code
df_sub <- df |>
  dplyr::select(
    age, gender, agency_years,
    alcohol_use_scores, max_other_drug_score,
    k10_total, absenteeism, presenteeism
  ) |>
  mutate(
    # NA = did not use in past 3 months; treat as zero risk for modelling
     alcohol_use_scores = case_when(is.na(alcohol_use_scores) ~ 0, TRUE ~ alcohol_use_scores),
     max_other_drug_score = case_when(is.na(max_other_drug_score) ~ 0, TRUE ~ max_other_drug_score)
    # alcohol_use_scores = tidyr::replace_na(alcohol_use_scores, 0),
    # max_other_drug_score = tidyr::replace_na(max_other_drug_score, 0)
  )


  # variable labels used across all model tables:
  labs_vars <- c(
  agency_years = "Years in agency",
  age = "Age",
  gender = "Gender",
  alcohol_use_scores = "Alcohol use risk",
  max_other_drug_score = "Maximum other drug use risk",
  k10_total = "Psychological distress",
  `max_other_drug_score:k10_total` = "Other drug use risk x Psychological distress"
)

Univariable Models

Show/hide the code
# function to run univariable models at once 
run_uv_hurdle <- function(outcome, predictors, 
                          data, exponentiate = T) {
  
  # build both models seperately 
  model_tables <- map(predictors, ~ {
  fmla <- as.formula(paste0(outcome, " ~ ", .x, " | ", .x))
  model <- hurdle(fmla, data = data, dist = "negbin", zero.dist = "binomial")
    
  # logit part 
  tbl_logit <- tbl_regression(
    model,
    component = "zero_inflated",
    exponentiate = TRUE,
    estimate_fun = function(x) formatC(x, digits = 2, format = "f"),
    pvalue_fun = function(x) {
      p <- style_pvalue(x, digits = 3)
      gsub("(?<=<)0\\.|^0\\.", ".", p, perl = TRUE)
    }, 
    tidy_fun = broom.helpers::tidy_zeroinfl
  ) |> 
    modify_header(label = "Variable", estimate = "OR") |> 
    modify_table_body(~ .x |>
                        mutate(
                          label = ifelse(
                            row_type == "label" & variable %in% names(labs_vars),
                            labs_vars[variable],
                            label
                          ),
                          ci = ifelse(
                            !is.na(estimate) & (conf.high - conf.low > 50),
                            ">50",
                            ci
                          )
                        )
    ) |> 
    add_n() 
  
  # NB count part
  tbl_count <- tbl_regression(
    model,
    component = "conditional",
    exponentiate = T,
    estimate_fun = function(x) formatC(x, digits = 2, format = "f"),
    pvalue_fun = function(x) {
      p <- style_pvalue(x, digits = 3)
      # remove leading zero from both "0.03" and "<0.001"
      gsub("(?<=<)0\\.|^0\\.", ".", p, perl = TRUE)
    },
    
    tidy_fun = broom.helpers::tidy_zeroinfl
  ) |> 
    modify_header(label = "Variable", estimate = "IRR") |> 
    modify_table_body(~ .x |>
                        mutate(
                          label = ifelse(
                            row_type == "label" & variable %in% names(labs_vars),
                            labs_vars[variable],
                            label
                          ),
                          ci = ifelse(
                            !is.na(estimate) & (conf.high - conf.low > 50),
                            ">50",
                            ci
                          )
                        )) 
  
  list(tbl_logit = tbl_logit, tbl_count = tbl_count)
  })

  # separate and flatten count and zero tables
  tbls_logit  <- map(model_tables, "tbl_logit")
  tbls_count <- map(model_tables, "tbl_count")
  
  tbl_merge(
    tbls = list(
      tbl_stack(tbls_logit),
      tbl_stack(tbls_count) 
      ),
    tab_spanner = c("Hurdle model (logit)", "Count model (NB)")
  )
}

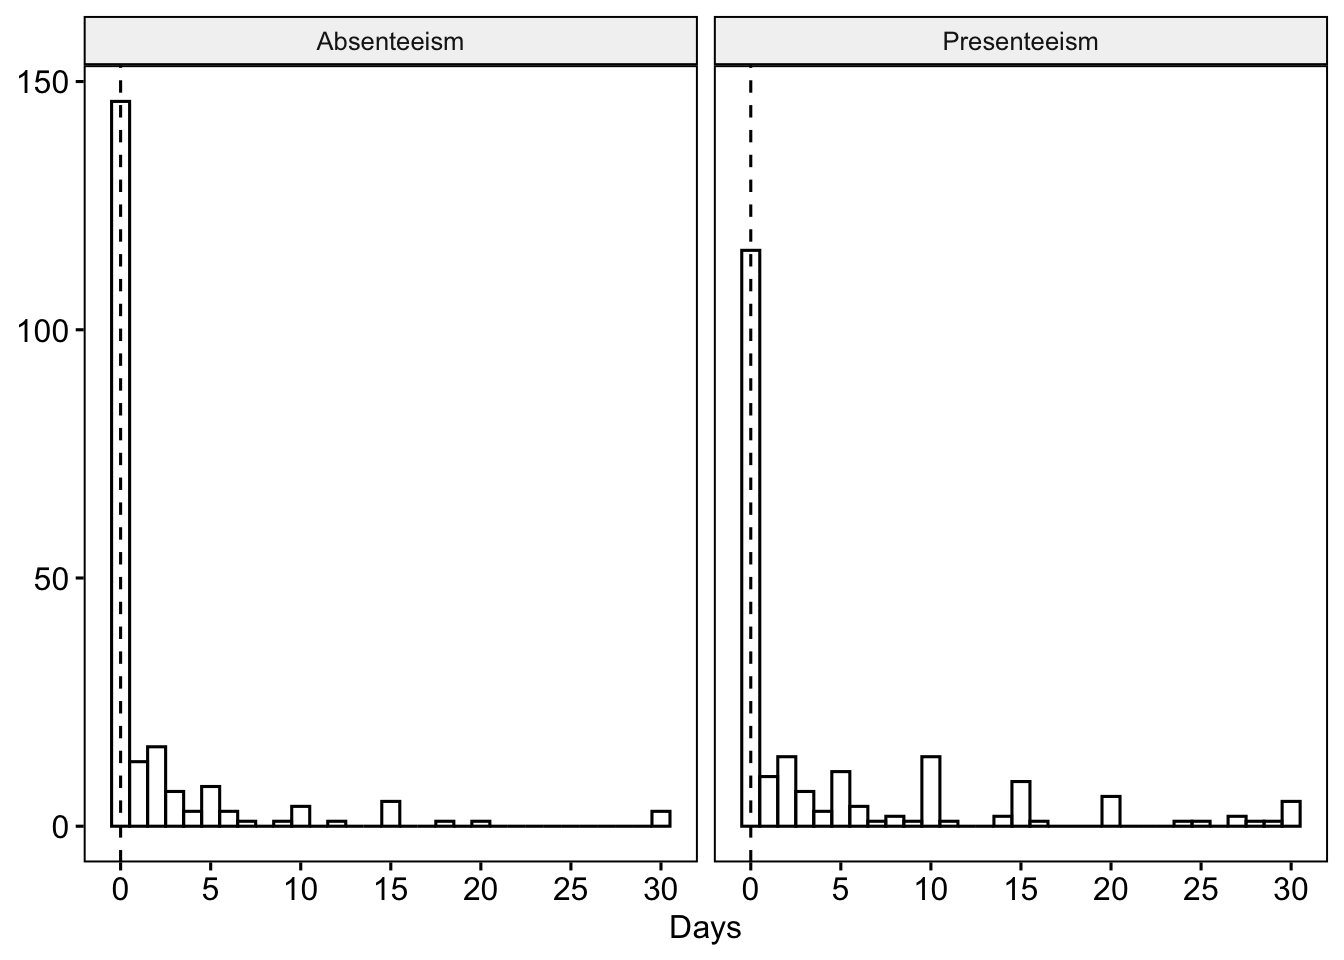
## apply to absenteeism 

outcome <- "absenteeism"
predictors <- df_sub |> dplyr::select(-presenteeism, -absenteeism) |> names()

tbl_abs_uv <- suppressMessages(
  run_uv_hurdle(outcome, predictors, data = df_sub, exponentiate = TRUE)
) 

tbl_abs_uv <- tbl_abs_uv |> 
  modify_table_body(~ .x |>
    mutate(
      estimate_1 = number(estimate_1, accuracy = .01),
      estimate_1 = if_else(is.na(estimate_1), "—", estimate_1),
      estimate_2 = number(estimate_2, accuracy = .01),
      estimate_2 = if_else(is.na(estimate_2), "—", estimate_2),
      label = case_when(label == "0" ~ "No", label == "1" ~ "Yes", TRUE ~ label),
      groupname_col_1 = NULL,
      groupname_col_2 = NULL
    )
  ) |>
  as_flex_table() |>
  delete_part("footer") 


# change spanning headers
typology <- data.frame(
  col_keys = tbl_abs_uv$col_keys,
  head1 = c("", "", rep("Hurdle Model (logit)", 3), rep("Count Model (NB)", 3)),
  head2 = c("Variable", "N", "OR", "95% CI", "p", "IRR", "95% CI", "p"),
  stringsAsFactors = FALSE
)

# print and format 
tbl_abs_uv <- tbl_abs_uv |>
  set_header_df(mapping = typology, key = "col_keys") |> 
  merge_h(part = "header") |>
  my_flextable(font_size = 10)

# fix NA
tbl_abs_uv <- flextable::compose(tbl_abs_uv, i = 2, j = c(3, 4, 6, 7), value = flextable::as_paragraph(" "))
tbl_abs_uv <- flextable::compose(tbl_abs_uv, i = 3, j = c(3, 4, 6, 7), value = flextable::as_paragraph("\u2014"))


tbl_abs_uv

Hurdle Model (logit)

Count Model (NB)

Variable

N

OR

95% CI

p

IRR

95% CI

p

Age

200

0.99

0.96, 1.02

.434

1.01

0.97, 1.05

.584

Gender

201

Man or male

Woman or female

1.24

0.67, 2.29

.492

2.24

1.09, 4.60

.028

Years in agency

209

0.99

0.95, 1.02

.426

0.99

0.94, 1.05

.761

Alcohol use risk

213

1.05

1.02, 1.08

<.001

1.00

0.97, 1.03

.806

Maximum other drug use risk

213

1.10

1.05, 1.16

<.001

1.01

0.98, 1.04

.476

Psychological distress

213

1.17

1.11, 1.22

<.001

1.09

1.05, 1.14

<.001

Higher alcohol use risk, greater other drug use risk, and higher psychological distress were all associated with increased odds of reporting any absenteeism; age, gender, and years employed at the agency were not associated with the likelihood of reporting any absenteeism. For those reporting any absenteeism, psychological distress and gender were associated with the frequency of absenteeism.

Multivariable model

Predictors showing evidence of association in either component for the univariable models were retained for multivariable modelling.

Show/hide the code
formula_abs <- absenteeism ~ gender + alcohol_use_scores + max_other_drug_score + k10_total
mod_abs_mv <- hurdle(formula_abs, data = df_sub, dist = "negbin", zero.dist = "binomial")

# check multicollinearity 
car::vif(lm(formula_abs, data = df_sub))
              gender   alcohol_use_scores max_other_drug_score 
            1.037990             1.136693             1.066019 
           k10_total 
            1.155369 

All vifs were below 5 (ranging from 1.04-1.16)

Show/hide the code
# define merged table with both components
tbl_abs_mv <- list(
  
  # logit component 
  logit = suppressMessages(tbl_regression(
    mod_abs_mv,
    component = "zero_inflated",
    exponentiate = TRUE,
    estimate_fun = function(x) formatC(x, digits = 2, format = "f"),
    pvalue_fun = function(x) {
      p <- style_pvalue(x, digits = 3)
      gsub("(?<=<)0\\.|^0\\.", ".", p, perl = TRUE)
    },
    tidy_fun = broom.helpers::tidy_zeroinfl)) |> 
    modify_header(label = "Variable", estimate = "OR") |>
    modify_table_body(~ .x |>
      mutate(
        label = if_else(row_type == "label" & variable %in% names(labs_vars), labs_vars[variable], label)
       )) |> 
        add_n(),

  # count component 
  count = suppressMessages(tbl_regression(
    mod_abs_mv,
    component = "conditional",
    exponentiate = TRUE,
    estimate_fun = function(x) formatC(x, digits = 2, format = "f"),
    pvalue_fun = function(x) {
      p <- style_pvalue(x, digits = 3)
      gsub("(?<=<)0\\.|^0\\.", ".", p, perl = TRUE)
    },
    tidy_fun = broom.helpers::tidy_zeroinfl)) |>
    modify_header(label = "Variable", estimate = "IRR") |>
    modify_table_body(~ .x |>
      mutate(
        label = if_else(
          row_type == "label" & variable %in% names(labs_vars),
          labs_vars[variable],
          label
        )
      )) |>
      add_n()) |> 
      tbl_merge(tab_spanner = c("Odds of Absenteeism", "Frequency of Absenteeism"))

tbl_abs_mv <- tbl_abs_mv |> 
  modify_table_body(~ .x |> 
    mutate(
      groupname_col_1 = NULL, 
      estimate_1 = number(estimate_1, accuracy = .01),
      #estimate_1 = if_else(is.na(estimate_1), "—", estimate_1),
      ci_1 = paste(number(conf.low_1, accuracy = .01), ", ", number(conf.high_1, accuracy = .01)),
      ci_1 = if_else(ci_1 == "NA, NA", "  ", ci_1),
      groupname_col_2 = NULL, 
      stat_n_2 = NULL, 
      estimate_2 = number(estimate_2, accuracy = .01),
      #estimate_2 = if_else(is.na(estimate_2), "-", estimate_2),
      ci_2 = paste(number(conf.low_2, accuracy = .01), ", ", number(conf.high_2, accuracy = .01)),
      ci_2 = if_else(ci_2 == "NA, NA", "  ", ci_2),

    )
  ) |>
  as_flex_table() |>
  delete_part("footer") 

tbl_abs_mv <- flextable::compose(tbl_abs_mv, i = 1, j = c(3, 4, 6, 7), value = flextable::as_paragraph(" "))
tbl_abs_mv <- flextable::compose(tbl_abs_mv, i = 2, j = c(3, 4, 6, 7), value = flextable::as_paragraph("\u2014"))

# change spanning headers
typology <- data.frame(
  col_keys = tbl_abs_mv$col_keys,
  head1 = c("", "", rep("Odds of Absenteeism", 3), rep("Frequency of Absenteeism", 3)),
  head2 = c("Variable", "N", "OR", "95% CI", "p", "IRR", "95% CI", "p"),
  stringsAsFactors = FALSE
)

tbl_abs_mv <- tbl_abs_mv |>
  set_header_df(mapping = typology, key = "col_keys") |> 
  merge_h(part = "header") |>
  my_flextable(font_size = 10)


tbl_abs_mv
Table 6: Multivariable hurdle negative binomial model predicting absenteeism

Odds of Absenteeism

Frequency of Absenteeism

Variable

N

OR

95% CI

p

IRR

95% CI

p

Gender

201

Man or male

Woman or female

1.54

0.73, 3.24

.259

1.02

0.49, 2.12

.949

Alcohol use risk

201

1.03

1.00, 1.06

.048

0.99

0.97, 1.02

.624

Maximum other drug use risk

201

1.09

1.02, 1.15

.007

0.98

0.95, 1.02

.374

Psychological distress

201

1.14

1.08, 1.20

<.001

1.10

1.04, 1.16

<.001

Higher alcohol use risk, greater other drug use risk, and higher psychological distress were all associated with increased odds of reporting any absenteeism. Effect of gender was attentuated and was no longer associated with likelihood. Higher psychological distress was associated with higher counts. No other predictors were associated with frequency once any absence had occurred.

Interactions

Interactions were not significant and likelihood ratio tests showed adding the interactions added no extra value.

Show/hide the code
mod_abs_alc_k10 <- absenteeism ~ gender + alcohol_use_scores*k10_total + max_other_drug_score
mod_abs_drug_k10 <- absenteeism ~ gender + max_other_drug_score*k10_total + alcohol_use_scores

mod_abs_alc_k10_mod <- hurdle(mod_abs_alc_k10, data = df_sub, 
                          dist = "negbin", zero.dist = "binomial")
mod_abs_drug_k10_mod <- hurdle(mod_abs_drug_k10, data = df_sub, 
                           dist = "negbin", zero.dist = "binomial")


# lrt 
lrtest(mod_abs_mv, mod_abs_alc_k10_mod)
Likelihood ratio test

Model 1: absenteeism ~ gender + alcohol_use_scores + max_other_drug_score + 
    k10_total
Model 2: absenteeism ~ gender + alcohol_use_scores * k10_total + max_other_drug_score
  #Df  LogLik Df  Chisq Pr(>Chisq)
1  11 -238.68                     
2  13 -238.17  2 1.0297     0.5976
Show/hide the code
lrtest(mod_abs_mv, mod_abs_drug_k10_mod)
Likelihood ratio test

Model 1: absenteeism ~ gender + alcohol_use_scores + max_other_drug_score + 
    k10_total
Model 2: absenteeism ~ gender + max_other_drug_score * k10_total + alcohol_use_scores
  #Df  LogLik Df  Chisq Pr(>Chisq)
1  11 -238.68                     
2  13 -238.09  2 1.1946     0.5503

Interactions were not significant and likelihood ratio tests showed adding the interactions added no extra value.

Modelling Presenteeism

Univariable models

Show/hide the code
outcome <- "presenteeism"
predictors <- df_sub |> dplyr::select(-presenteeism, -absenteeism) |> names()

tbl_pres_uv <- suppressMessages(
  run_uv_hurdle(outcome, predictors, data = df_sub, exponentiate = TRUE)
) 

tbl_pres_uv <- tbl_pres_uv |> 
  modify_table_body(~ .x |>
    mutate(
      estimate_1 = number(estimate_1, accuracy = .01),
      estimate_1 = if_else(is.na(estimate_1), "—", estimate_1),
      estimate_2 = number(estimate_2, accuracy = .01),
      estimate_2 = if_else(is.na(estimate_2), "—", estimate_2),
      label = case_when(label == "0" ~ "No", label == "1" ~ "Yes", TRUE ~ label),
      groupname_col_1 = NULL,
      groupname_col_2 = NULL
    )
  ) |>
  as_flex_table() |>
  delete_part("footer") 


# change spanning headers
typology <- data.frame(
  col_keys = tbl_pres_uv$col_keys,
  head1 = c("", "", rep("Hurdle Model (logit)", 3), rep("Count Model (NB)", 3)),
  head2 = c("Variable", "N", "OR", "95% CI", "p", "IRR", "95% CI", "p"),
  stringsAsFactors = FALSE
)

# print and format 
tbl_pres_uv <- tbl_pres_uv |>
  set_header_df(mapping = typology, key = "col_keys") |> 
  merge_h(part = "header") |>
  my_flextable(font_size = 10)

# fix NA
tbl_pres_uv <- flextable::compose(tbl_pres_uv, i = 2, j = c(3, 4, 6, 7), value = flextable::as_paragraph(" "))
tbl_pres_uv <- flextable::compose(tbl_pres_uv, i = 3, j = c(3, 4, 6, 7), value = flextable::as_paragraph("\u2014"))

tbl_pres_uv
Table 7: Univariable hurdle negative binomial regressions predicting presenteeism

Hurdle Model (logit)

Count Model (NB)

Variable

N

OR

95% CI

p

IRR

95% CI

p

Age

200

0.97

0.95, 1.00

.029

1.00

0.98, 1.03

.864

Gender

201

Man or male

Woman or female

0.99

0.57, 1.74

.982

0.97

0.62, 1.52

.907

Years in agency

209

0.97

0.94, 1.00

.050

1.00

0.97, 1.03

.957

Alcohol use risk

213

1.03

1.01, 1.06

.015

1.01

0.99, 1.02

.419

Maximum other drug use risk

213

1.08

1.03, 1.13

.002

1.01

0.99, 1.04

.260

Psychological distress

213

1.12

1.08, 1.17

<.001

1.05

1.02, 1.09

<.001

Age, years in the agency, higher alcohol use risk, greater other drug use risk, and higher psychological distress were all associated with increased odds of reporting any presenteeism; For those reporting any presenteeism, only psychological distress was associated with the frequency of presenteeism.

Multivariable model

Show/hide the code
formula_pres <- presenteeism ~ age + agency_years + alcohol_use_scores + max_other_drug_score + k10_total
mod_pres_mv <- hurdle(formula_pres, data = df_sub, dist = "negbin", zero.dist = "binomial")

# check multicollinearity 
car::vif(lm(formula_pres, data = df_sub))
                 age         agency_years   alcohol_use_scores 
            2.107382             2.085608             1.139047 
max_other_drug_score            k10_total 
            1.120903             1.184623 

all vifs were below 5 (ranging from 1.12-2.11)

Show/hide the code
# define merged table with both components
tbl_pres_mv <- list(
  
  # logit component 
  logit = suppressMessages(tbl_regression(
    mod_pres_mv,
    component = "zero_inflated",
    exponentiate = TRUE,
    estimate_fun = function(x) formatC(x, digits = 2, format = "f"),
    pvalue_fun = function(x) {
      p <- style_pvalue(x, digits = 3)
      gsub("(?<=<)0\\.|^0\\.", ".", p, perl = TRUE)
    },
    tidy_fun = broom.helpers::tidy_zeroinfl)) |> 
    modify_header(label = "Variable", estimate = "OR") |>
    modify_table_body(~ .x |>
      mutate(
        label = if_else(row_type == "label" & variable %in% names(labs_vars), labs_vars[variable], label)
       )) |> 
        add_n(),

  # count component 
  count = suppressMessages(tbl_regression(
    mod_pres_mv,
    component = "conditional",
    exponentiate = TRUE,
    estimate_fun = function(x) formatC(x, digits = 2, format = "f"),
    pvalue_fun = function(x) {
      p <- style_pvalue(x, digits = 3)
      gsub("(?<=<)0\\.|^0\\.", ".", p, perl = TRUE)
    },
    tidy_fun = broom.helpers::tidy_zeroinfl)) |>
    modify_header(label = "Variable", estimate = "IRR") |>
    modify_table_body(~ .x |>
      mutate(
        label = if_else(
          row_type == "label" & variable %in% names(labs_vars),
          labs_vars[variable],
          label
        )
      )) |>
      add_n()) |> 
      tbl_merge(tab_spanner = c("Odds of Presenteeism", "Frequency of Presenteeism"))

tbl_pres_mv <- tbl_pres_mv |> 
  modify_table_body(~ .x |> 
    mutate(
      groupname_col_1 = NULL, 
      estimate_1 = number(estimate_1, accuracy = .01),
      #estimate_1 = if_else(is.na(estimate_1), "—", estimate_1),
      ci_1 = paste(number(conf.low_1, accuracy = .01), ", ", number(conf.high_1, accuracy = .01)),
      ci_1 = if_else(ci_1 == "NA, NA", "  ", ci_1),
      groupname_col_2 = NULL, 
      stat_n_2 = NULL, 
      estimate_2 = number(estimate_2, accuracy = .01),
      #estimate_2 = if_else(is.na(estimate_2), "-", estimate_2),
      ci_2 = paste(number(conf.low_2, accuracy = .01), ", ", number(conf.high_2, accuracy = .01)),
      ci_2 = if_else(ci_2 == "NA, NA", "  ", ci_2),

    )
  ) |>
  as_flex_table() |>
  delete_part("footer") 

# change spanning headers
typology <- data.frame(
  col_keys = tbl_pres_mv$col_keys,
  head1 = c("", "", rep("Odds of Presenteeism", 3), rep("Frequency of Presenteeism", 3)),
  head2 = c("Variable", "N", "OR", "95% CI", "p", "IRR", "95% CI", "p"),
  stringsAsFactors = FALSE
)

tbl_pres_mv <- tbl_pres_mv |>
  set_header_df(mapping = typology, key = "col_keys") |> 
  merge_h(part = "header") |>
  my_flextable(font_size = 10)


tbl_pres_mv
Table 8: Multivariable hurdle negative binomial model predicting presenteeism

Odds of Presenteeism

Frequency of Presenteeism

Variable

N

OR

95% CI

p

IRR

95% CI

p

Age

199

0.97

0.94, 1.01

.210

1.00

0.97, 1.02

.834

Years in agency

199

0.99

0.95, 1.04

.797

1.00

0.97, 1.03

.994

Alcohol use risk

199

1.02

0.99, 1.05

.150

1.01

0.99, 1.02

.409

Maximum other drug use risk

199

1.05

0.99, 1.11

.076

1.01

0.99, 1.04

.215

Psychological distress

199

1.11

1.06, 1.16

<.001

1.06

1.02, 1.09

<.001

Unlike absenteeism, alcohol and other drug use risk were not associated with odds of presenteeism, but psychological distress was. Effect of age and agency years was attentuated and was no longer associated with likelihood

Psychological distress was associated with higher counts. no other predictors were associated with frequency once any presenteeism had occurred.

Interactions

Show/hide the code
mod_pres_alc_k10 <- presenteeism ~ age + agency_years + alcohol_use_scores*k10_total + max_other_drug_score
mod_pres_drug_k10 <- presenteeism ~ age + agency_years + max_other_drug_score*k10_total + alcohol_use_scores

mod_pres_alc_k10_mod <- hurdle(mod_pres_alc_k10, data = df_sub, 
                          dist = "negbin", zero.dist = "binomial")
mod_pres_drug_k10_mod <- hurdle(mod_pres_drug_k10, data = df_sub, 
                           dist = "negbin", zero.dist = "binomial")

lrtest(mod_pres_mv, mod_pres_drug_k10_mod)
Likelihood ratio test

Model 1: presenteeism ~ age + agency_years + alcohol_use_scores + max_other_drug_score + 
    k10_total
Model 2: presenteeism ~ age + agency_years + max_other_drug_score * k10_total + 
    alcohol_use_scores
  #Df  LogLik Df  Chisq Pr(>Chisq)    
1  13 -407.58                         
2  15 -398.59  2 17.978  0.0001248 ***
---
Signif. codes:  0 '***' 0.001 '**' 0.01 '*' 0.05 '.' 0.1 ' ' 1
Show/hide the code
lrtest(mod_pres_mv, mod_pres_alc_k10_mod)
Likelihood ratio test

Model 1: presenteeism ~ age + agency_years + alcohol_use_scores + max_other_drug_score + 
    k10_total
Model 2: presenteeism ~ age + agency_years + alcohol_use_scores * k10_total + 
    max_other_drug_score
  #Df  LogLik Df  Chisq Pr(>Chisq)
1  13 -407.58                     
2  15 -406.37  2 2.4158     0.2988

Results showed no significant interaction or added value of the additonal alcohol use model. But results showed a significant interaction with other drug use and psychological distress for both components of the model

Show/hide the code
# define merged table with both components
tbl_pres_mv2 <- list(
  
  # logit component 
  logit = suppressMessages(tbl_regression(
    mod_pres_drug_k10_mod,
    component = "zero_inflated",
    exponentiate = TRUE,
    estimate_fun = function(x) formatC(x, digits = 2, format = "f"),
    pvalue_fun = function(x) {
      p <- style_pvalue(x, digits = 3)
      gsub("(?<=<)0\\.|^0\\.", ".", p, perl = TRUE)
    },
    tidy_fun = broom.helpers::tidy_zeroinfl)) |> 
    modify_header(label = "Variable", estimate = "OR") |>
    modify_table_body(~ .x |>
      mutate(
        label = if_else(row_type == "label" & variable %in% names(labs_vars), labs_vars[variable], label)
       )) |> 
        add_n(),

  # count component 
  count = suppressMessages(tbl_regression(
    mod_pres_drug_k10_mod,
    component = "conditional",
    exponentiate = TRUE,
    estimate_fun = function(x) formatC(x, digits = 2, format = "f"),
    pvalue_fun = function(x) {
      p <- style_pvalue(x, digits = 3)
      gsub("(?<=<)0\\.|^0\\.", ".", p, perl = TRUE)
    },
    tidy_fun = broom.helpers::tidy_zeroinfl)) |>
    modify_header(label = "Variable", estimate = "IRR") |>
    modify_table_body(~ .x |>
      mutate(
        label = if_else(
          row_type == "label" & variable %in% names(labs_vars),
          labs_vars[variable],
          label
        )
      )) |>
      add_n()) |> 
      tbl_merge(tab_spanner = c("Odds of Presenteeism", "Frequency of Presenteeism"))

tbl_pres_mv2 <- tbl_pres_mv2 |> 
  modify_table_body(~ .x |> 
    mutate(
      groupname_col_1 = NULL, 
      estimate_1 = number(estimate_1, accuracy = .01),
      #estimate_1 = if_else(is.na(estimate_1), "—", estimate_1),
      ci_1 = paste(number(conf.low_1, accuracy = .01), ", ", number(conf.high_1, accuracy = .01)),
      ci_1 = if_else(ci_1 == "NA, NA", "  ", ci_1),
      groupname_col_2 = NULL, 
      stat_n_2 = NULL, 
      estimate_2 = number(estimate_2, accuracy = .01),
      #estimate_2 = if_else(is.na(estimate_2), "-", estimate_2),
      ci_2 = paste(number(conf.low_2, accuracy = .01), ", ", number(conf.high_2, accuracy = .01)),
      ci_2 = if_else(ci_2 == "NA, NA", "  ", ci_2),

    )
  ) |>
  as_flex_table() |>
  delete_part("footer") 

# change spanning headers
typology <- data.frame(
  col_keys = tbl_pres_mv2$col_keys,
  head1 = c("", "", rep("Odds of Presenteeism", 3), rep("Frequency of Presenteeism", 3)),
  head2 = c("Variable", "N", "OR", "95% CI", "p", "IRR", "95% CI", "p"),
  stringsAsFactors = FALSE
)

tbl_pres_mv2 <- tbl_pres_mv2 |>
  set_header_df(mapping = typology, key = "col_keys") |> 
  merge_h(part = "header") |>
  my_flextable(font_size = 10)


tbl_pres_mv2
Table 9: Multivariable hurdle negative binomial model with interaction predicting presenteeism

Odds of Presenteeism

Frequency of Presenteeism

Variable

N

OR

95% CI

p

IRR

95% CI

p

Age

199

0.98

0.94, 1.02

.328

1.00

0.97, 1.03

.956

Years in agency

199

0.99

0.94, 1.04

.648

1.00

0.96, 1.03

.821

Maximum other drug use risk

199

1.38

1.16, 1.65

<.001

1.08

1.00, 1.16

.056

Psychological distress

199

1.16

1.10, 1.23

<.001

1.07

1.03, 1.11

<.001

Alcohol use risk

199

1.02

0.99, 1.05

.127

1.01

0.99, 1.02

.256

Other drug use risk x Psychological distress

199

0.99

0.98, 1.00

<.001

1.00

1.00, 1.00

.085

Significant interaction effect of other drug use and psychological distress on odds of presenteeism.

Margins

Show/hide the code
options(marginaleffects_safe = FALSE)
df_sub <- df_sub |>
  mutate(presenteeism1 = ifelse(presenteeism >= 1, 1, 0))

means <- df_sub |>
  summarise(
    age_mean = mean(age, na.rm = TRUE),
    agency_years_mean = mean(agency_years, na.rm = TRUE),
    alcohol_mean = mean(alcohol_use_scores, na.rm = TRUE),
    k10_mean = mean(k10_total, na.rm = TRUE),
    k10_sd = sd(k10_total, na.rm = TRUE)
  )

k10_low <- with(means, k10_mean - k10_sd)
k10_high <- with(means, k10_mean + k10_sd)
m <- glm(
  presenteeism1 ~ age +
    agency_years +
    max_other_drug_score * k10_total +
    alcohol_use_scores,
  data = df_sub,
  family = binomial
)

preds <- avg_predictions(
  m,
  by = c("max_other_drug_score", "k10_total"),
  newdata = datagrid(
    max_other_drug_score = 0:40,
    k10_total = c(k10_low, k10_high)
  )
)
# extract predicted probabilities at min/max drug score for each k10 level
preds |>
  filter(max_other_drug_score %in% c(0, 40)) |>
  dplyr::select(
    max_other_drug_score,
    k10_total,
    estimate,
    conf.low,
    conf.high
  ) |>
  mutate(across(c(estimate, conf.low, conf.high), ~ round(.x * 100, 1)))

 Estimate 2.5 % 97.5 %
     18.0   9.8   26.3
     69.3  57.0   81.6
     99.7  98.7  100.8
     87.5  66.0  109.1
Show/hide the code
# marginal effect of drug score at low vs high distress
comparisons(
  m,
  variables = "max_other_drug_score",
  newdata = datagrid(k10_total = c(k10_low, k10_high))
)

 k10_total Estimate Std. Error    z Pr(>|z|)   S   2.5 % 97.5 %
      13.9   0.0388    0.01292 3.00  0.00266 8.6  0.0135 0.0641
      29.5   0.0058    0.00576 1.01  0.31423 1.7 -0.0055 0.0171

Term: max_other_drug_score
Type: response
Comparison: +1
Show/hide the code
# test whether marginal effects differ between distress levels
comparisons(
  m,
  hypothesis = "b2-b1=0",
  variables = "max_other_drug_score",
  newdata = datagrid(k10_total = c(k10_low, k10_high))
)

 Hypothesis Estimate Std. Error     z Pr(>|z|)   S   2.5 %  97.5 %
    b2-b1=0   -0.033     0.0108 -3.07  0.00217 8.8 -0.0541 -0.0119

Type: response

Analysis of marginal effects showed that at lower levels of psychological distress (1 SD below the mean = 13.9), the predicted probability of presenteeism ranged from 18% at zero other drug use risk, to 99.7% at max risk. At high levels of psychological distress, probabilities ranged from 69.3% at low levels of risk to 87.5% at maximum risk.

However, the high psychological distress x maximum other drug use risk group had an upper confidence interval exceeding 100. So the effect of other drug use risk on presenteeism is less certain at higher levels of distress.

Note!!!

Each one point increase in other drug use risk was associated with a 3.9% increase in the probability of presenteeism at low psychological distress (p = .003), whereas the effect is attenuated and non-significant at high psychological distress (0.6% increase; p = .310). The difference in marginal effects between low and high distress was significant (b = -0.03, p = .002), indicating that the effect of other drug use risk on presenteeism is significantly stronger at lower levels of psychological distress.

Plot

Show/hide the code
colourpal <- c("#1b9e77", "#d95f02", "#7570b3", "#e7298a", "#e6ab02")
preds <- preds %>% mutate(distress = if_else(k10_total < 13.9, "Low","High"),
                 distress = factor(distress, levels = c("Low", "High"), labels = c("Low (mean - 1 SD)", "High (mean + 1 SD)"),
                                   ordered = TRUE))

preds %>% ggplot(aes(x = max_other_drug_score, y = estimate, color = distress, fill = distress)) +
  geom_line(size = 1) +
  geom_ribbon(aes(ymin = conf.low, ymax = conf.high), alpha = 0.3, colour = NA) +
  scale_y_continuous(
    labels = label_percent(accuracy = 1),
   breaks = seq(0, 1, by = 0.1), limits = c(0, 1.10) ) +
  scale_x_continuous(breaks = seq(0, 40, 5), limits = c(0, 40)) + 
  scale_colour_manual(values = c("#1b9e77","#7570b3")) +    
  scale_fill_manual(values = c("#1b9e77","#7570b3")) +
    
    labs(
      x = "Maximum other drug use risk score (ASSIST)",
      y = "Predicted probability of presenteeism",
      color = "Psychological distress (K10+)",
      fill = "Psychological distress (K10+)"
    ) +
    theme_pubr(base_size = 13) +
    labs_pubr()
Figure 2: Predicted probability of any presenteeism by other drug use risk and psychological distress

(Note. Lines show model-based predictions from the logit component of the hurdle negative binomial model for presenteeism plotted over maximum other drug use risk scores (0-40) at low (1 SD below the mean) and high (1 SD above the mean) levels of psychological distress (M = 21.7, SD = 7.8). Shaded areas represent 95% confidence intervals. All other covariates in the final model (age, years working for agency, alcohol use risk) are held at their sample means. The significant interaction shows that when psychological distress is low, increases in other drug use risk are associated with an increase in the probability of any presenteeism. At higher levels of psychological distress, the baseline probability of presenteeism is elevated and the effect of other drug use risk is attentuated)

Interpretation

Risky levels of alcohol use, drug use, and psychological distress were prevalent in the sample. Alcohol use, other drug use, and psychological distress predicted the odds of absenteeism, and other drug use predicted the odds of presenteeism (particularly when psychological distress was low). Psychological distress was the most consistent predictor of the odds and frequency of both absenteeism and presenteeism. This suggests that psychological distress is the primary driver of occupational impairment in PSP. AOD use contributes to occupational impairment, but in ways that differ across contexts (absenteeism/presenteeism), and substance classes (alcohol vs other drugs)