 to continue moving across from old notes
Show/hide the code
# school days
statemeans <- as_tibble(
  round(seqmeant(seqs, serr = TRUE), 1),
  rownames = "State"
) |>
  mutate(State = labels) |>
  mutate(
    Sample = "s",
    Percent = round(Mean / 1440 * 100, 1),
    ifelse(grepl("\\.", Percent), Percent, paste0(Percent, ".0"))
  ) |>
  as.data.frame() |>
  select(State, Mean, Percent, SD = Stdev) |>
  mutate(
    Percent = paste0(Percent, "%"),
    Mean = ifelse(grepl("\\.", Mean), Mean, paste0(Mean, ".0")),
    SD = ifelse(grepl("\\.", SD), SD, paste0(SD, ".0")),
    Mean = paste0(Mean, " (", SD, ")")
  ) |>
  select(-SD) |>
  rename(`Mean minutes (SD)` = Mean, `% of Day` = Percent)

# non school days
statemeann <- as_tibble(
  round(seqmeant(seqn, serr = TRUE), 1),
  rownames = "State"
) |>
  mutate(State = labels) |>
  mutate(
    Sample = "Non-s",
    Percent = round(Mean / 1440 * 100, 1),
    ifelse(grepl("\\.", Percent), Percent, paste0(Percent, ".0"))
  ) |>
  as.data.frame() |>
  select(State, Mean, Percent, SD = Stdev) |>
  mutate(
    Percent = paste0(Percent, "%"),
    Mean = ifelse(grepl("\\.", Mean), Mean, paste0(Mean, ".0")),
    SD = ifelse(grepl("\\.", SD), SD, paste0(SD, ".0")),
    Mean = paste0(Mean, " (", SD, ")")
  ) |>
  select(-SD) |>
  rename(`Mean minutes (SD)` = Mean, `% of Day` = Percent)


# create overall descriptives table
descriptives <- statemeans |> left_join(statemeann, by = "State")
descriptives <- descriptives |>
  rename(
    minss = `Mean minutes (SD).x`,
    percs = `% of Day.x`,
    minsn = `Mean minutes (SD).y`,
    percn = `% of Day.y`,
  )

descriptives_tbl <- descriptives |> flextable()

typology <- data.frame(
  col_keys = names(descriptives_tbl$body$dataset),
  head = c("", rep("School days", 2), rep("Non-school days", 2)),
  head2 = c(
    "Activity",
    rep(c("Mean minutes (SD)", "% of Day"), 2)
  )
)
descriptives_tbl <- descriptives_tbl |>
  set_header_df(mapping = typology, key = "col_keys") |>
  merge_at(i = 1, j = c(2:3), part = "header") |>
  merge_at(i = 1, j = c(4:5), part = "header") |>
  align(align = "center", j = c(2:5), part = "all") |>
  my_flextable() |>
  hline(i = c(1, 2), part = "header", border = fp_border(color = "black")) |>
  hline_top(border = fp_border(color = "black"), part = "all") |>
  hline_bottom(border = fp_border(color = "black"), part = "all")

descriptives_tblSchool days | Non-school days | |||
|---|---|---|---|---|
Activity | Mean minutes (SD) | % of Day | Mean minutes (SD) | % of Day |
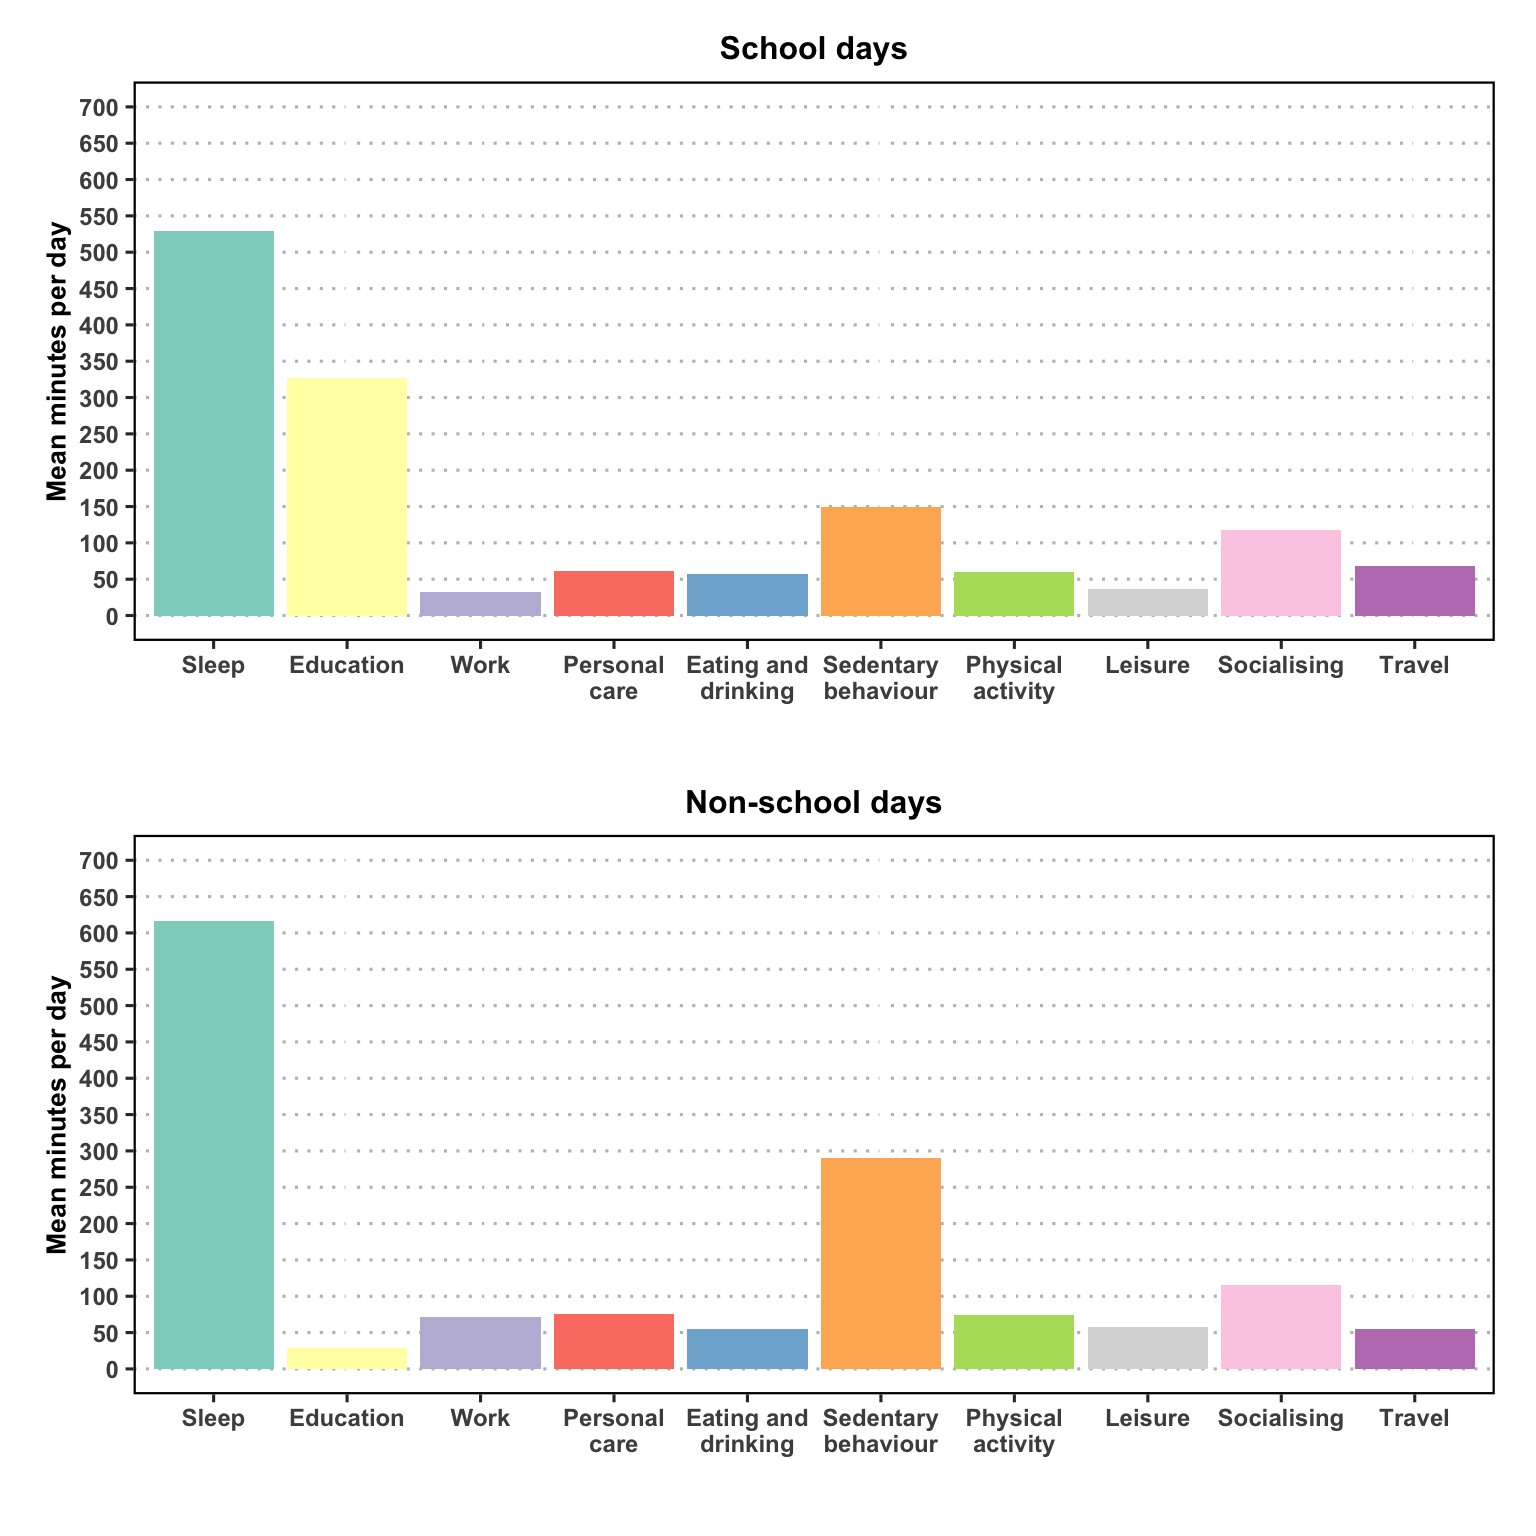
Sleep | 528.8 (65.3) | 36.7% | 617.1 (108.0) | 42.9% |
Education | 326.5 (112.2) | 22.7% | 28.5 (77.6) | 2% |
Work (paid/unpaid) | 33.0 (52.4) | 2.3% | 70.9 (103.5) | 4.9% |
Personal care | 61.3 (50.8) | 4.3% | 75.5 (80.6) | 5.2% |
Eating and drinking | 57.8 (86.6) | 4% | 54.8 (75.3) | 3.8% |
Sedentary behaviour | 149.1 (126.8) | 10.4% | 290.5 (187.4) | 20.2% |
Physical activity | 60.5 (75.9) | 4.2% | 74.6 (98.3) | 5.2% |
Leisure | 36.9 (60.2) | 2.6% | 58.2 (90.6) | 4% |
Socialising | 118.2 (110.9) | 8.2% | 115.4 (139.7) | 8% |
Travel | 67.9 (61.4) | 4.7% | 54.4 (81.2) | 3.8% |